Casually inspecting/editing PHP files? Install XDebug with your Vim!
Note: this is not a tutorial on what XDebug is and how it exactly works, or an install howto. If you want that, then please read this post on box.net. This post is more like a 'declaration of awesomeness'. I just wanted to blog about it - and I think this things needs more 'advertising'. Maybe this illustration will give someone who's googling for 'vim' and 'xdebug' a still better idea what this is about.
My story:
I'm still slowly trying out different things once in a while, to get to the optimal working environment for my coding work. (Which goes very slowly, because there's always such a lot of other things to finish before you can make free time...)
At my first employer doing Drupal (PHP) coding work, I used NetBeans, and since this spring I've used Eclipse. Both are OK... (I thought I liked Eclipse better when I installed it at first, but I'll probably end up switching back and forth a few times to compare newest releases.) This summer I also installed XDebug and started to learn how to use its Eclipse integration. Man, why haven't I figured that out before? Why hasn't every single PHP programmer immediately pointed me to this in the past year? I didn't know that there are free open source interactive debugging tools that work well. It's hard to imagine living without such a tool, once you started using it. It takes some 'getting to know how to install it' (like so many things in Linux), but it's really worth having a debugger.
But, getting to the point... of course, there's a disadvantage to Eclipse: if you don't have a computer with a solid state drive, a zillion Mhz and a quadrillion gigs of RAM. It takes about a week to start up. So if I'm just looking through a file to study what it looks like, I start up vi, not Eclipse.
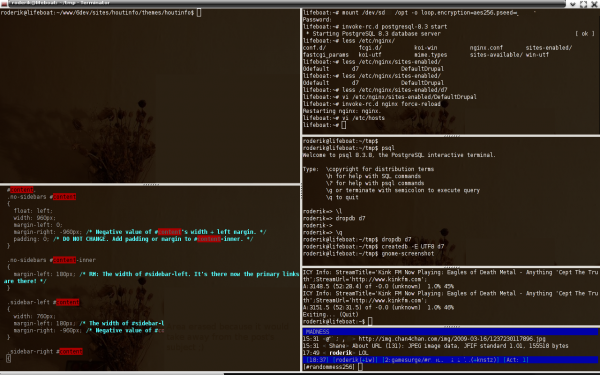
So this is the usual screen I stare at half the day (at least 'the one with the terminals' - there's also the one with the browser, with the mail client, and with the IM clients & miscellaneous stuff...).
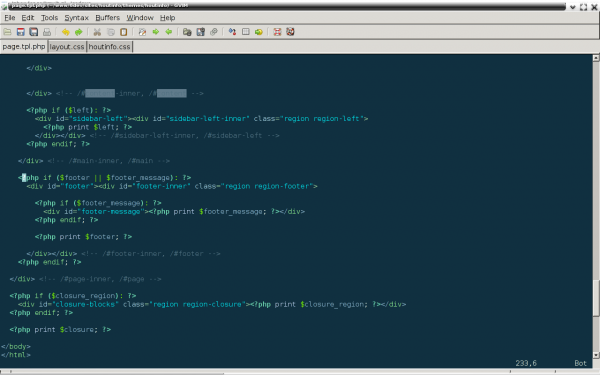
...well, if I just did some small editing work on 3 related files, I would have 3 vi sessions open in different terminals... but for using XDebug from vi, I will have to diverge from that routine and start using gvim. Here's me recently working on a zen-based theme. That isn't heavy PHP coding work; I was just modifying CSS, and editing page.tpl.php to shove DIVs around. Not something I felt like using Eclipse for if I could help it.
But now I've come this far, I really want to check whether $footer and/or $footer_message are filled in certain pages, because I forgot which variable means what. How do I do this? Start up a huge and bloated IDE to have a debugger? No way, man.
The only sacrifice you need to make is, you need to press a couple more buttons than in Eclipse. In Eclipse, one 'debug' button will set up the debugger, start the browser, and make sure that the two connect to each other. This is not automated in the Vim XDebug client; you need to start up the debugger, and get your browser to make a connection to the XDebug server, separately. The last thing is done by appending '?XDEBUG_SESSION_START=1' to the URL. And there is a nice Firefox extension that can do just that; it's a little toggle button which will add this to your URLs automatically, when turned on.
So, assuming the XDebug client is loaded in Vim, and you have the URL of the web page you want to debug in your browser already. What do you do to inspect $footer / $footer_message?
- Type ':Bp' in Vim to set a breakpoint
- Press F5 in Vim (it will say “waiting for a new connection on port 9000 for 5 seconds…” at the bottom of the screen)
- Within 5 seconds, go to your web browser, make sure this 'XDebug button' is on (or you've added '?XDEBUG_SESSION_START=1' to the URL), and (re)load the page
- switch back to Vim... and you'll see a message that the debug server has received a connection, and "Press ENTER or type command to continue".
I was so used to debugging in Eclipse already, that this was a surprise for me. It's there immediately. It doesn't take seconds of disk activity and clunky UI changes. and you waiting until everything's settled down, to get a line in your editor that indicates where the debugging process is. This 'press F5, switch to browser, press F5 again, switch back' is definitely faster than pressing one button in Eclipse.
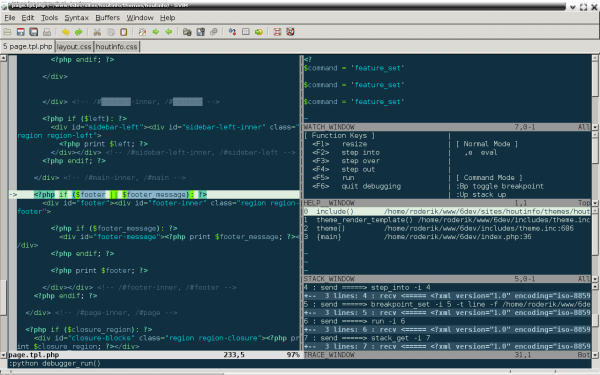
Now you're in Vim again, press any command - like F5 (which in debug mode means "run"), and you'll hopefully arrive at the breakpoint you've set:
Here's why you really need to run gvim, not vim in a text terminal: you suddenly have a lot more 'windows' on your vim screen. And with gvim, you can resize them by dragging the grey borders. You really want that, I promise.
So now? Do what you want. See the commands in the 'Help window'. Select any variable and press F12 to see its value -- or press ',e' in command mode and then type the variable name (or 'print_r($variable, TRUE)' for arrays) to see its value. Do the usual debugging. Have a ball.
So is this the solution to all problems?
Ehm, no.
I'm not a hardcore vi fanboy and its command mode does not make me more productive during big coding sessions. I'm one of those wimps who wants some fancy color bar on the right of his GUI, to tell him when he's got too little/few closing brackets. And I like other debuggers for their subwindow listing all variables with their values, with arrays as a clickable tree.
But I just notice myself starting vi instead of Eclipse, if I quickly wanna check something, or edit a PHP file to do a not-so-invasive bugfix. (Which is about 80% of times I test a new Drupal contrib module for this site...) I just can't be bothered waiting for Eclipse to start up.
And this surely beats having to start a full IDE just to debug a line somewhere!


Recent comments
11 years 1 week ago
11 years 1 week ago
15 years 41 weeks ago
15 years 41 weeks ago
15 years 45 weeks ago
16 years 26 weeks ago
16 years 38 weeks ago
16 years 38 weeks ago
17 years 32 weeks ago
17 years 35 weeks ago